Dry Reservoirs, Dark Cities
Can the size of Lake Kariba in satellite images predict Zambia’s power cuts months ahead?
Image Credit: Courtney Lindeque
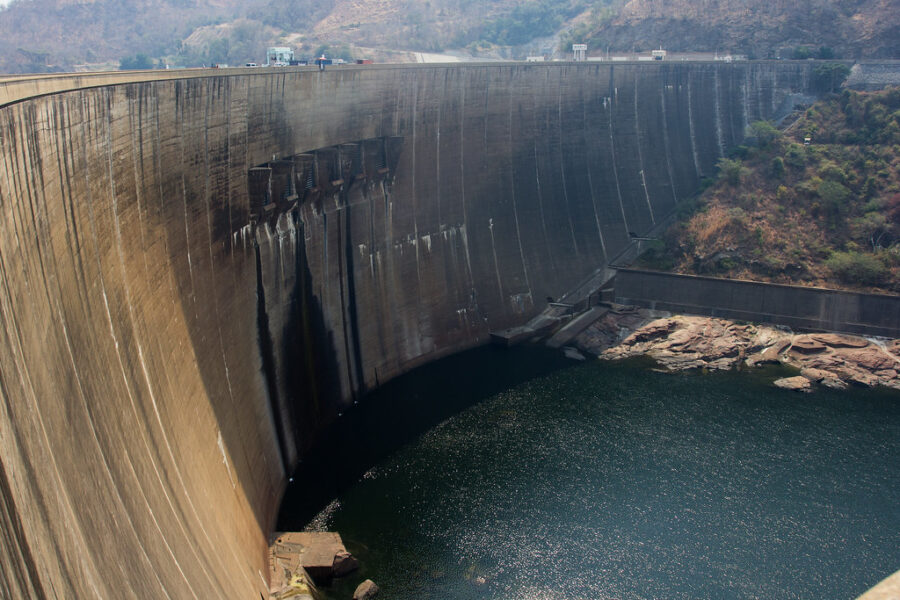
In 2024 Lake Kariba dropped to 15 percent of its usable storage and Zambia went to 12-hour daily power cuts, because the dam's turbines had too little water to run. The size of the lake can be measured from satellite images every month, going back to 1984. We will build a model that uses the lake's area and the rainfall over its basin in recent months to predict how much electricity the Kariba plant generates, and test how many months ahead a shortfall shows up. We will check the forecast against the plant's reported output and against nighttime satellite images of Lusaka, which dim when the power goes out.
Research questions
How well does the lake's area, together with rainfall over the basin in the months before, predict the plant's monthly output one, three and six months ahead?
How many months before the 2024 shortfall would the model have raised a warning, and how often would it have raised one when nothing happened?
Datasets
JRC Global Surface Water monthly history (lake area, 1984 to 2021) and Sentinel-2 and Sentinel-1 images for 2022 onward
CHIRPS rainfall over the Zambezi basin above the dam
Monthly generation figures for Kariba North Bank from Zambezi River Authority and ZESCO reports
NASA Black Marble monthly nighttime lights for Lusaka
OpenStreetMap power lines and substations, WorldPop population, hospital locations
Machine learning
A gradient boosting regression model that predicts monthly generation from lake area and rainfall over the previous one to twelve months, tested by holding out whole years
A simple classifier on the same features that flags the start of a shortfall, with hit and false-alarm rates reported by lead time
GIS
Outline the reservoir and the drainage basin above the dam (HydroSHEDS), and average each month's rainfall over that basin
Map the grid area the plant serves from OpenStreetMap lines and substations, and count the people and hospitals inside it
Pull Lusaka's nighttime-light values for the same months to compare with the forecast
References
Zambezi River Authority (March 2024). Press statement on the hydrological situation at Kariba Dam. (LINK ERROR)