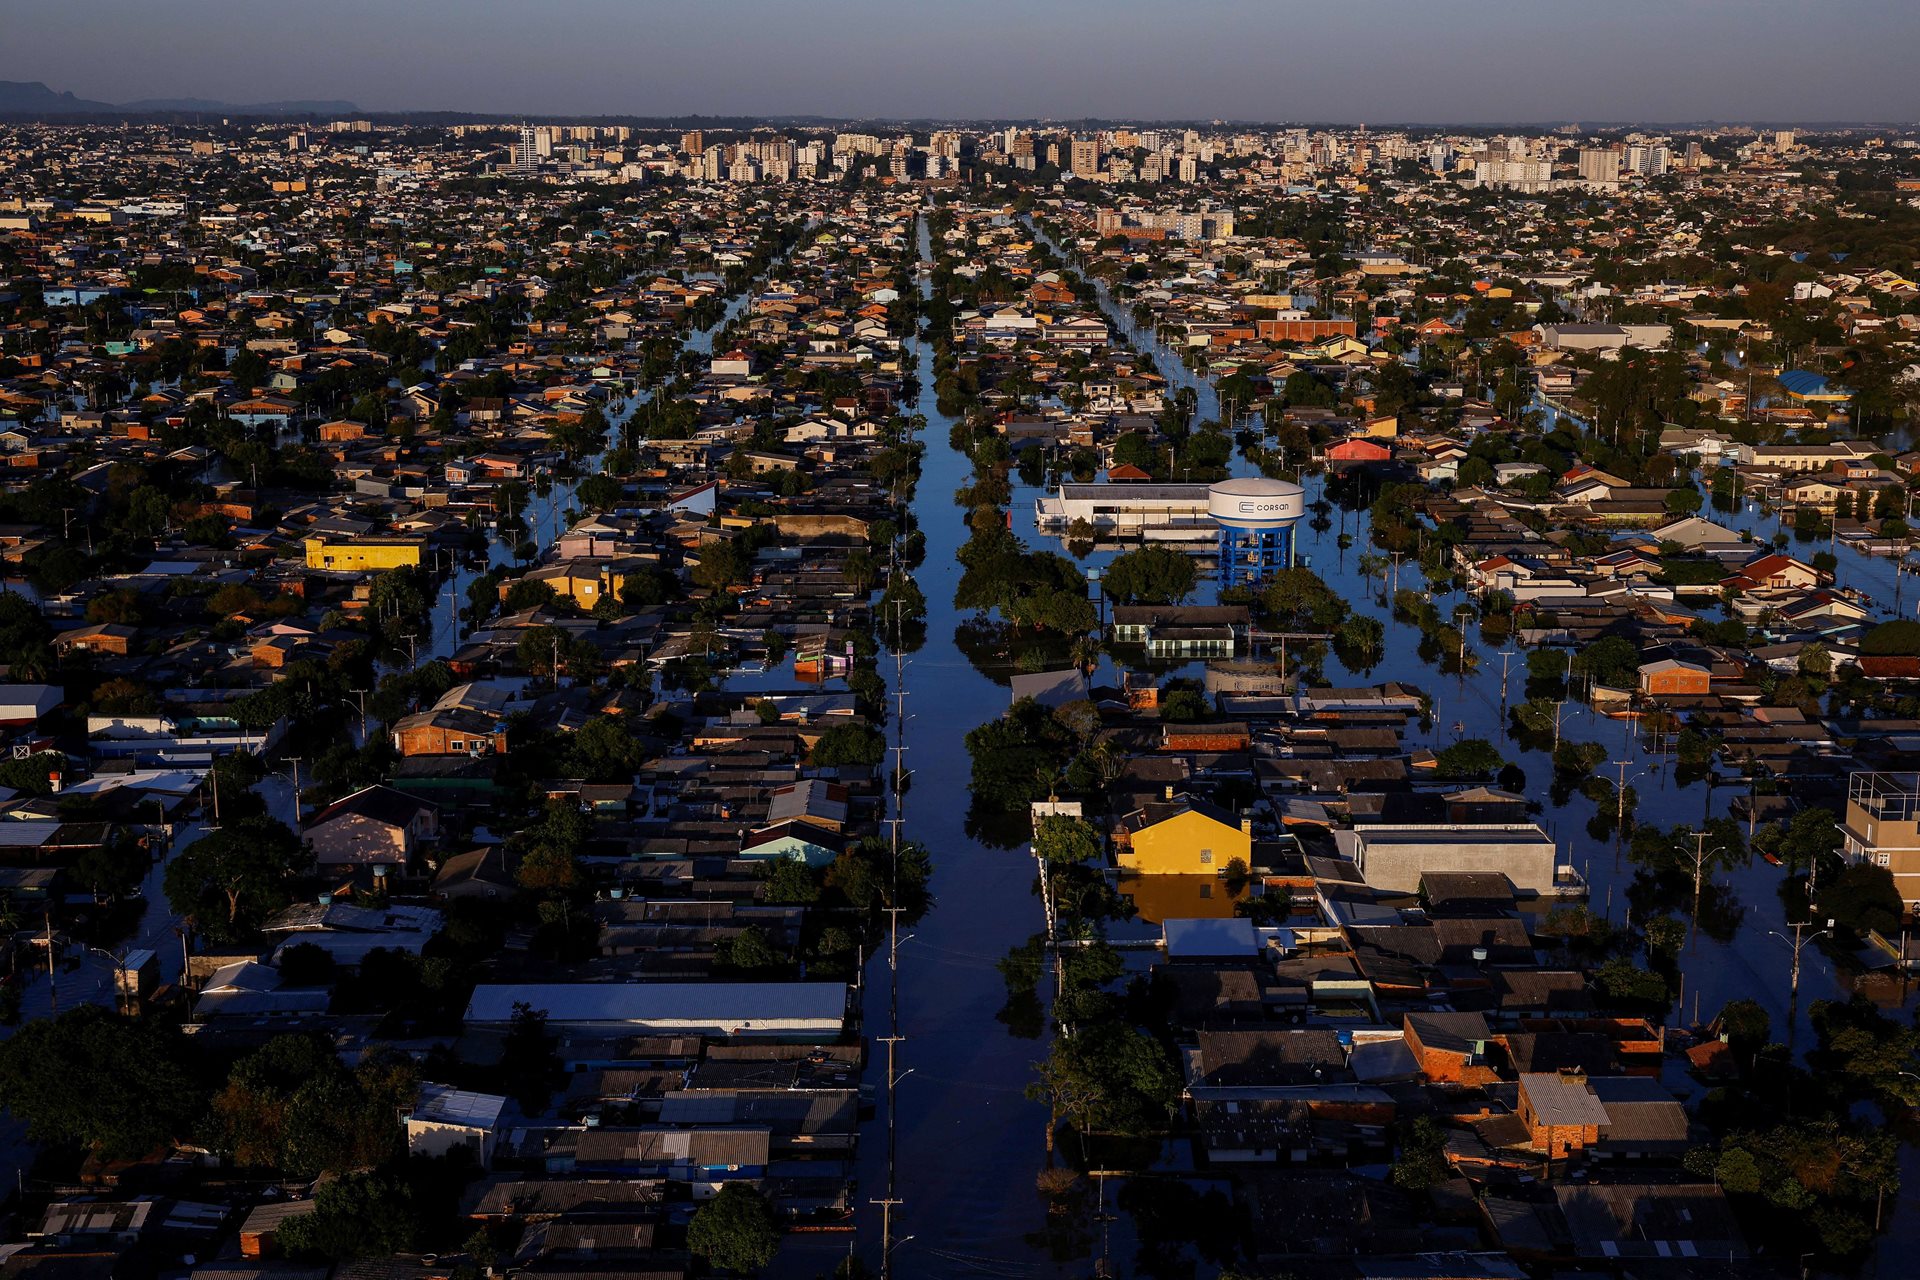
Dark Floods
How accurately can flood history and terrain data pinpoint electrical substations at risk of shutting down?
Image Credit: Amanda Maciel Perobelli
When a flood reaches an electrical substation, everything it feeds loses power at once, including hospitals and water pumps. In May 2024 that happened across Porto Alegre, Brazil. We will overlay the city's mapped substations on the radar flood maps from that event and on ten years of recorded floods, train a model to predict which substations flood from their height above the river and how often the land around them has flooded before, and assign each hospital and pump to its nearest substation. The output is a map of which parts of the city lose power when which substation floods, with the substation list going to the utility.
Research questions
Which of Porto Alegre's substations were inside the May 2024 flood, and which had been inside earlier recorded floods?
Can a substation's height above the nearest stream, its distance to the river and the flood history of the land around it predict whether it flooded, well enough to apply to substations in a city with no recorded flood?
Datasets
Copernicus Global Flood Monitoring radar flood maps, 2015 to now, including May 2024
JRC Global Surface Water recurrence, for how often each spot has flooded since 1984
FABDEM elevation, for height above the nearest stream
OpenStreetMap substations (with voltage tags), power lines, hospitals and water pumping stations
WorldPop population; city and utility reports on which areas lost power in May 2024
Methodology in progress.
References
Copernicus Emergency Management Service (2024). Global Flood Monitoring data availability and download. (LINK ERROR)